Enhance your abilities. Improve your business intelligence. Study data analytics.
Get ready to supercharge your data analysis skills with our dynamic and empowering course! In this exciting program, you will uncover the incredible responsibilities and functions of a data analyst, equipping you with the knowledge and tools to excel in this rapidly evolving field.
Throughout the course, you will dive deep into the world of data analysis, discovering a wide array of methods and best practices aligned with both business and technical requirements. With a special emphasis on cutting-edge tools like Power BI, Microsoft Analysis Services, and other powerful data analysis tools, you’ll gain the expertise to model, visualize, and analyze data like a true data pro.
We understand that data comes in all shapes and sizes, which is why our course goes beyond traditional relational databases and explores non-relational data sources as well. You’ll learn how to access and process data from various sources, harnessing their potential to uncover invaluable insights.
Security is a top priority in the data-driven era, and we’ve got you covered. Our course will guide you through implementing robust security standards and policies across the entire Power BI spectrum, including datasets and groups. You’ll gain the confidence to handle sensitive data with utmost care and protect your organization’s information assets effectively.
But that’s not all! We go the extra mile by delving into the world of report management and deployment. You’ll master the art of crafting visually stunning reports and dashboards that captivate and engage your audience. Plus, with our comprehensive guide, you’ll discover the best ways to share and distribute your reports and dashboards, ensuring your insights reach the right people at the right time.
As an added bonus, we’ll introduce you to the captivating realm of Power Apps. With this powerful component of the Power Platform, you’ll be able to build and utilize apps that seamlessly connect to your business data. Picture this: using the Power Apps visual, you can pass context-aware data to a canvas app, which updates in real-time as you make changes to your report. Imagine the power of deriving business insights and taking immediate action, all within your Power BI reports and dashboards. It’s a game-changer!
And there’s even more good news! Our course offers a comprehensive exam at the end, where you can showcase your newfound skills and earn a valuable certification. Stand out in the job market and demonstrate your ability to leverage data effectively for informed decision-making. Your certification will be a testament to your dedication and expertise in the field of data analysis.
Don’t miss out on this extraordinary opportunity to transform your data analysis capabilities and propel your career to new heights. Enroll today and unlock a world of possibilities!
Course Outline:
Module 1 – Query Tools
1.1 Course Introduction
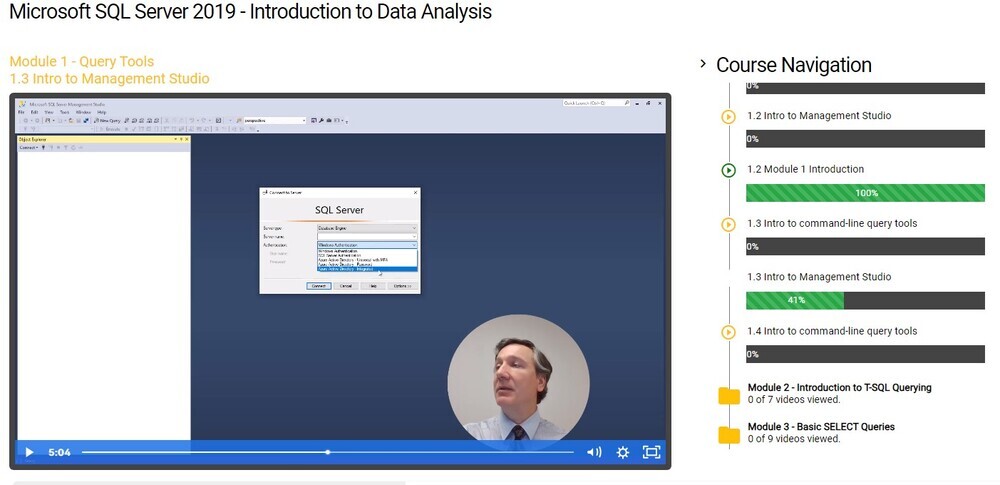
1.2 Intro to Management Studio
1.3 Intro to command-line query tools
Module 2 – Introduction to T-SQL Querying
2.1 Introducing T-SQL
2.2 Understanding Sets
2.3 Understanding the Logical Order of Operations in SELECT Statements
Module 3 – Basic SELECT Queries
3.1 Writing Simple SELECT Statements
3.2 Eliminate Duplicates with DISTINCT
3.3 Using Column and Table Aliases
3.4 Write Simple CASE Expressions
Module 4 – Querying Multiple Tables
4.1 Understanding Joins
4.2 Querying with Inner Joins
4.3 Querying with Outer Joins
4.4 Querying with Cross Joins and Self Joins
Module 5 – Sorting and Filtering Data
5.1 Sorting Data
5.2 Filtering Data with Predicates
5.3 Filtering with the TOP and OFFSET-FETCH
5.4 Working with Unknown Values
Module 6 – Introduction to Business Intelligence and Data Modeling
6.1 Introduction to Business Intelligence
6.2 The Microsoft Business Intelligence Platform
6.3 Exploring a Data Warehouse
6.4 Exploring a Data Model
Module 7 – Prepare Data
7.1 Introduction to Power BI
7.2 Get data from various data sources
7.3 Preview source data
Module 8 – Clean, Transform, and Load Data
8.1 Data Transformation Intro
8.2 Transformation Example 1
8.3 Transformation Example 2
8.4 Transformation Example 3
8.5 Transformation Example 4
8.6 Transformation Example 5
8.7 Transformation Example 6
Module 9 – Design a Data Model
9.1 Introduction to Data Modeling
9.2 Model Relationships
9.3 Table Configuration
9.4 Model interface
9.5 Quick Measures
9.6 Many-to-many relationships
9.7 Row-level security
Module 10 – Create Model Calculations using DAX
10.1 DAX context
10.2 Calculated Tables
10.3 Calculated Columns
10.4 Managing Date Tables
10.5 Measures
10.6 Filter Manipulation
10.7 Time Intelligence
Module 11 – Create Reports
11.1 Basic Report Creation
11.2 Example Page 1
11.3 Example Page 2
11.4 Example Page 3
11.5 Report Publishing
11.6 Enhancing Reports
11.7 Drill-Through Pages
11.8 Conditional Formatting
11.9 Buttons and Bookmarks
Module 12 – Create Dashboards
12.1 Dashboard Basics
12.2 Real-Time Dashboards
12.3 Enhanced Dashboards
Module 13 – Create Paginated Reports
13.1 Introduction to Power BI Report Builder
13.2 Report Layouts
13.3 Report Data
13.4 Report Tables
Module 14 – Perform Advanced Analytics
14.1 Introduction to Advanced Analytics
14.2 Scatter Chart
14.3 Forecast
14.4 Decomposition Tree
14.5 Key Influencers
Module 15 – Create and Manage Workspaces
15.1 Introduction to Workspaces
15.2 Working with Workspaces and the Portal
Module 16 – Create Power App Visuals
16.1 Introduction to Power Apps Visual
16.2 Creating the App
16.3 Basic Power Apps Concepts
16.4 Refreshing the Report
Module 17 – Analysis Services and Power BI
17.1 Introduction to Analysis Services
17.2 Connecting with Multidimensional Models
17.3 Premium Workspaces and Analysis Services
17.4 Course Wrap Up
Frequently Asked Questions About Microsoft SQL Server 2019 – Introduction to Data Analysis Course
What will I learn in the Microsoft SQL Server 2019 – Introduction to Data Analysis course?
How is the course content delivered?
Can I start learning right away?
What’s the outcome of completing this course?
Your Training Instructor

James Ring-Howell
Microsoft Certified Trainer | Microsoft Certified Developer | Database Expert
James is a full-stack developer with over 40 years of experience. He has developed applications across all major industries and for Fortune 100 companies as well as local small businesses. James has also been teaching technology courses for over 20 years. In addition to his extensive background in technology, he has also worked as a professional opera singer.